Published
8th April 2024
Categories
Perspective News, The Cambridge Weekly
Share
The Cambridge Weekly –8th April 2024
Bumpy start to the quarter
Following on from two very strong quarters for investors in risk assets, the start of the second quarter has seen a sudden change of mood, and the first distinct bout of equity volatility this year.
Indeed, last Thursday, the American leading stock market index, the S&P 500 had the largest one-day percentage range (high/low) in over a year. The last major hiccup was when the US regional bank SVB fell in March 2023. The banking problems back then elicited an infusion of liquidity from the US central bank, the Federal Reserve (Fed), which not only helped stabilise markets but actually fed the next stage of the rally.
Last week’s bout of volatility will almost certainly not cause any policy response, given there is no comparable market surprise or shock. Rather, we suspect it is a consequence of the bull run which started last October, and the increasingly large dispersion of valuations for US equities and corporate bonds, depending on whether they belong to large or small companies.
This does not make a snappy headline for fast moving capital markets journalists, so instead they blamed the usual suspects first. The events of Easter Monday in the Middle-East, meant a nervous start to the shortened week. It may be taking some time, but the Israel-Iran conflict does seem to be expanding rather than stabilising. The bombing of a diplomatic building adjacent to the Iranian embassy in Damascus might have been the spur for direct conflict. However, so far Iran responded only with a chilling promise of retribution rather than immediate revenge.
Nevertheless, oil traders were primed for a massive rise in oil prices but there was only a relatively small move over late Monday and Tuesday. However, in the afternoon session on Thursday and without any more big news, Brent crude oil prices broke above $90 per barrel while, at the same time, large cap US equities sold off, in particular the most highly valued (expensive) stocks.
We write about the backdrop to oil prices in the first of our separate articles and, for a change this month, round up March’s asset returns in the second article.
The other plausible suspect for last week’s volatility is quarterly asset allocation moves by large investors. As the quarter closed, we mentioned how period ends can be dominated by the tidying up of investor portfolios – taking profits out of the winners and topping up the underperformers. The flip-side is that the start of a new period is when active investors are likely to institute new active positions. Last week’s market moves suggest that a number of large investors are prepared to diversify away from the narrowing group of US mega-caps.
Investors may be confident of economic growth in the US, but so far have believed that the beneficiaries of strong expenditure are a few large companies. Investment in Artificial Intelligence (AI) research and equipment has benefited the likes of Nvidia and Microsoft, but not the world of small and mid-sized companies, who drove up their earnings by buying their chips and software to improve their productivity through investing in their application of AI. This view has been mirrored in analyst profit forecasts for each group, as the chart below illustrates.
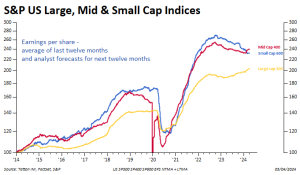
US companies form the bulk of global equity indices, so we’ll look at them specifically. The above chart shows the earnings expectations for large, mid and small sized companies as defined by S&P (the S&P 500, S&P 400 and S&P 600 respectively).
Despite the continued US growth, the two groups of non-large-cap have seen actual profits and profit expectations fall over the past year. This is quite unusual and suggests a different growth dynamic to the one we are used to. At the same time, it is a good reason for small and mid-cap company share prices to underperform relative to the large cap representing S&P 500. To be clear, this still does not mean that US small and mid-cap companies have cheap price-to-earnings valuations compared to normal. The small and mid-cap indices are priced around the 20-year averages, which are both about 15.5 times one year’s earnings. The S&P 500, by contrast, is trading at a price-to-earnings ratio of 21.8 times – against its 20-year average of 16.7 times.
If the S&P 500 were to move back to average valuation through an increase in earnings (rather than decline in share prices), it would have to see earnings rise by 30% for the index price to stand still. Relatively (on our measure), small and mid-cap earnings have fallen by about 11% since 2023 while the S&P 500 earnings have climbed about 8%, a relative change of slightly less than 20%. Moreover, large caps are still building in earnings growth outperformance despite having already done so.
Of course, large cap earnings outperformance has not just been about AI. There are many other factors, and the biggest is probably the financing environment. We have mentioned frequently that a regime of high short rates disproportionately affects smaller companies whose balance sheets and cash-flows are generally weaker than large caps. Until interest rates have actually begun to be cut, smaller companies will face a tough time.
Current growth is strong enough to give a bit of profit growth but also strong enough to keep unemployment down and wage demands up. That was particularly evident in March’s US employment
report, where there was yet another big gain in US jobs. The pace of job growth is now above 2% annualised, having slowed in the autumn. Wage growth (at 4.1% annualised) is no longer accelerating but it is not falling back either. Therefore, consumer demand is highly likely to be well supported. A nominal growth rate of around 5% looks likely to stay in place.
Against this backdrop of healthy economic growth, we heard last week various Fed members downplay the likelihood of near-term rate cuts, and the data above tells us why. It remains encouraging for smaller companies that they continue to say that rate cuts are likely eventually, but interest rate traders and bond investors keep pushing the timing of the first cut further towards the second half of the year.
The Fed’s chair Jerome Powell spoke last week and said little about current monetary policy of note. He spent more time talking about the benefits of policy being independent of politics. This is clearly an issue where the Fed feels vulnerable. They may have to move rates while campaigning for this year’s presidential election has effectively begun, and are desperate for this to be seen as non-partisan. Nevertheless, they are still in a difficult position regarding Treasury bond holdings. We have said it before, but it is remarkable that they continue to hold bonds while using a money market mechanism to soak up the excess liquidity that this has created. The imbalance of the financial system has resulted in an inverted yield curve (interest rates being higher than longer term bond yields), which has existed for longer than any other period – without it being accompanied by recession.
The Fed is understandably worried that rising longer bond yields might impact ailing commercial property portfolios of weak regional banks – and therefore bring about financial instability – but smaller companies are paying the price for those regional bank fragilities.
What does this mean for our view on last week’s market wobble? Given the very large and historically unusual valuation difference between the large and small cap segment of the market, there is a solid rationale for thinking small and mid-cap indices will outperform larger cap indices over the next two years. In a similar vein, the credit spread for smaller riskier companies – the difference between their borrowing rates and government bond yields – should go down when recession risks (and therefore the risk of defaults) decline
– and over the past 6 months they already have done so. Mid and small-cap equities however, currently still have higher risk premia (investors demand higher returns for the same level of risk) than large caps, but this is only justifiable if people think the US economy will stay as top-heavy (growth or returns focused on big companies) as it has been. But since interest rates are expected to fall, stable and more balanced growth is entirely plausible.
However, the risk is that short-rates may still move higher, rather than lower. That could be extremely difficult for those companies and their share prices in the short term. If last week’s market moves are the consequence of taking that long-term view, those brave investors could be in for a rocky ride.
Oil breaking higher
Oil prices have leapt up. In commentary last week, the most prominent explanation has been the escalation of hostilities in Ukraine and the Middle East, which threaten to disrupt global supplies.
However, price momentum has been building for some time. Supply is constrained and, in line with a resilient global economy, oil demand has also proved more resilient than expected. This has resulted in an impressive but underappreciated rally: Brent (Brent crude oil is the most traded and its price used as a benchmark) is up more than 17% year-to-date. At the time of writing, Europe’s Brent is sitting just above $91 per barrel, and the US’ WTI is above $86.
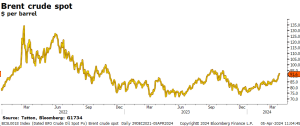
These are the highest prices since October. Back then, supply constraints, namely production cuts from OPEC+ (the Organization of the Petroleum Exporting Countries, plus a group of additional countries led by Russia, that works together to control production and therefore prices) pushed oil past the $90 mark. But weakness in global demand led to a sharp decline through the end of 2023. That was a significant part of the disinflation story markets have been excited about for months.
The current rally is therefore a challenge to this view. Falling energy prices had a big impact on inflation, both directly and indirectly. It lowered short-term costs and offered households and businesses a sense of reprieve, helping anchor inflation expectations. Central bankers were then more comfortable with the idea of cutting interest rates. This year’s oil rally has completely reversed the late autumn price falls, and it threatens to undo some of the inflation progress too.
Geopolitical tensions are the most immediate factor propelling oil. Iran has promised to retaliate against Israel for its airstrike on the Iranian embassy in Damascus. This might not be immediate, but we cannot discount the possibility that the conflict broadens, which would inevitably threaten global oil supplies.
Despite these setbacks, OPEC+ is unwavering in its call for supply discipline. The organisation, led by Saudi Arabia and Russia, agreed to extend production cuts of 2.2 million barrels a day until the end of June. The agreement, made in February, was left unchanged at its meeting last week, despite a big swing up in prices over the last month. The cartel has maintained a surprising level of discipline through a period that might have seen member countries peel off. In the past, the more financially-stressed countries have broken away, in order to produce more and get a bigger payoff.
In the short-term, Ukraine’s drone strikes against Russian oil refineries have had an impact on supply. These have intensified since mid-March. Russian supply to anyone not sanctioning them has been one of the key factors holding back global prices.
However, Russia’s longer term supply constraints may not be a result of self-discipline or military action. The departure of Western oil companies, following the imposition of sanctions, may have led to a loss of expertise in the maintenance of its oil production. Siberia’s ageing wells and the infrastructure surrounding them are particularly vulnerable. Actual production appears to be running substantially below the current agreed quota, with no sign of being able to increase, despite higher prices.
Supply constraints help to raise prices but more striking is the strength of global oil demand. Data from the Organisation for Economic Co-operation and Development (OECD) showed a large decline in oil inventories in January – a month that inventories usually build strongly. The inventory drop off is one of the biggest supporting factors for Brent and is a sign of stronger than expected demand. According to industry analysts, global oil demand in 2024 is running way ahead of consensus estimates.
China is a massive source of that demand. The world’s biggest oil importer has finally turned its ailing economy around, judging by the latest business sentiment surveys. Growth disappointment from China massively constrained global oil demand in 2023, but policy support from Beijing is now being matched by business and market confidence. Business sentiment surveys have also been surprisingly strong in the US, which could be a very significant source of better-than-expected oil demand.
Not only are the fundamentals looking strong for oil prices, but technical market factors suggest a break could be coming too. Brent has been sitting just below the psychologically important level of $90pb. If it breaks past that mark convincingly, history suggests it could bring in more speculative traders.
Last month, Cornerstone Analytics pointed out that the difference between oil prices now (known as spot prices) and the price for delivery in the future had widened significantly – spot prices are higher than for future deliveries. Cornerstone calls this a bullish divergence, and it has been an indicator for extended rallies in the past. Oil prices have momentum and speculative investors have almost certainly become involved. At the moment, it looks much more likely that speculative trading would be to the upside rather than the downside.
Up until last week, the oil price rise had gone fairly under the radar in terms of broader market discussions. Brent pushing above $90pb does not line up with the overall narrative that inflation has been beaten without hurting growth too much (in the US at least), meaning looser monetary policy, stable prices and yet still strong growth to come. But if rates fall and growth returns as markets expect, that will inevitably mean higher oil demand. With supplies tight and demand already above expectations, that is a recipe for oil prices staying high.
On the other hand, there are some signs that this rally may be closer to the end than the beginning. US oil production is stepping up, with a recent rise in productive oil rigs. The US is now an exporter and its producers are able to respond more quickly to price rises than other areas. It has a strong ability to meet demand.
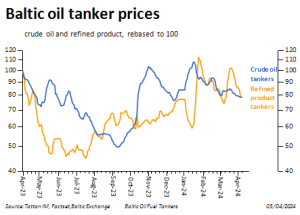
Meanwhile, OPEC may be minded to allow production to rise beyond agreed quotas, especially if Russia is not producing fully. As much as OPEC wants higher prices, it will not want sharply higher prices to crush nascent demand and the green shoots of a global recovery. It is still hard to tell how much demand is increasing. Tanker activity, for example, is not as strong as the oil price rises.
Lastly, many markets have seen speculative buying, but the sharp upswings have also tended to fizzle out quite quickly – something that may be attributable to AI-related trading algorithms. That could mean Brent crude oil spot prices rally to $100 per barrel, but anything beyond that will be hard to achieve.
March 2024 asset returns review
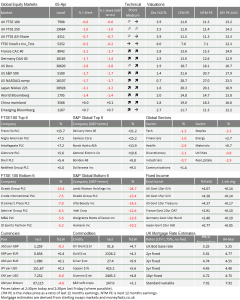
Springtime for investors; March was another strong one in capital markets. Global stocks gained 3.3% in sterling terms, supported by a strengthening of corporate earnings and a continued softening from central banks. The rally was broad based too, with virtually all major stock markets getting a fair share of the joy. Last month’s sunny spell caps off an overwhelmingly positive first quarter of the year. Global equities jumped 9.2% over the first three months of 2024 in sterling terms. The table below shows the monthly and quarterly returns for major regions and asset classes in full, as well as some longer term annualised return perspectives.
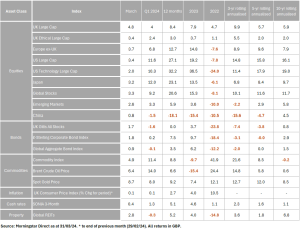
As we wrote last week, one of the key themes of the last month – and indeed Q1 overall – is the drop off in volatility. Not only has stock market volatility (as measured by the VIX index) come right the way down, but implied or expected option volatility has come down too – though still has some way to go. This tells us that the pricing or expectation of risk has come down and, by the same token, investors’ appetite for risk assets has increased.
Markets have watched inflation come down with glee, hoping that it will mean looser monetary policy despite growth remaining strong. This narrative, labelled “immaculate disinflation”, has been one of the key factors behind the massive rally from last autumn. Since October 27th, global stocks have jumped 20% in sterling terms.
Last month, central bankers finally started reading from the same page, giving more fuel to the rally. The Bank of England and the US Federal Reserve strongly suggested in their March meetings that interest rates would be cut in the summer. The European Central Bank was a little more cautious – not yet declaring inflation slain – but weak economic data and a surprise rate cut by Switzerland have markets convinced the ECB will follow suit.
Thanks to the softer messaging, bond yields came down last month, with the global aggregate bond index gaining 0.9% in sterling terms (bond prices go up when yields go down). This was actually counter to the Q1 trend overall, as the index was practically flat at -0.1%. Yields rose earlier in the year because markets
had gotten ahead of themselves into the year-end with regards to rate cuts. At the height of that strong rally, markets had priced in six rate cuts from the Fed and the ECB, and seven from the BoE – all of which are now closer to three.
It is a testament to how strong market sentiment has been that equities have roared ahead despite flat to negative bond markets. The UK had been lagging behind for most of 2024, but pushed ahead last month to post a 4.8% return for the FTSE 100. Rate cut talk from the BoE and generally brighter economic prospects helped UK stocks become March’s best performing developed market.
Another big factor behind the FTSE’s recent outperformance was the rally in oil prices – since UK large cap includes several big energy companies. Brent crude gained 6.4% in March, and oil has quietly risen to a five- month high of nearly $90 per barrel. These movements led to a 4.9% sterling gain for the broader commodity index. This was also helped by an impressive 8.7% jump in gold prices, as looser monetary policy is driving holders of liquidity to cash alternatives again.
Europe also defied expectations, jumping 3.7% through March in sterling terms. Even with weak economic data and the ECB giving little away, European equity has been climbing for five months straight, driven by the continent’s 11 biggest growth stocks: GSK, Roche, ASML, Nestle, Novartis, Novo Nordisk, L’Oreal, LVMH, AstraZeneca, SAP and Sanofi.
China was on the lower end of the spectrum, gaining just 0.8% in sterling terms through March and finishing Q1 -1.5% down. But this hides a noticeable rally into the end of the month, as investors began to get excited about long awaited growth in the world’s second-largest economy. Not only is Beijing coming through with significant policy support, but business sentiment surveys now show it is having an impact. Chinese equity has been middling for most of this year, and was poor for most of the last. Finally, though, this underperformance seems to be ending.
If China does turn strong again, that has big implications for the “immaculate disinflation” narrative. Global disinflation was in part a consequence of weak Chinese demand and overproduction driving down the price of consumer goods. If we expect stronger Chinese demand and private sector pricing power – as the latest sentiment surveys indicate – then we should also expect inflationary pressure to return, or at least an end to disinflation.
This is the most uncomfortable part of markets’ overwhelming optimism: there is a limit to how far it can go. Markets are racing ahead on the belief that risks are low and growth will be strong, but thinking risks are low does not necessarily mean they are. With equities already so strong, this makes valuations vulnerable. Any shocks – even small ones – could knock market sentiment. Any disappointment on earnings or, worse, global inflation shocks, could lead to a stock market reversal. Markets are currently completely unphased. Let’s hope their expectations are not too good to be true.
If anybody wants to be added or removed from the distribution list, please email enquiries@cambridgeinvestments.co.uk
Please note: Data used within the Personal Finance Compass is sourced from Bloomberg/FactSet and is only valid for the publication date of this document.
The value of your investments can go down as well as up and you may get back less than you originally invested.


