Published
4th March 2024
Categories
Perspective News, The Cambridge Weekly
Share
The Cambridge Weekly –4th March 2024
Winners and losers of stabilising yields
We ended February and started March with a week of positive price action in equities, although the US mega-caps did less well generally, while bond markets were rather stable. Indeed, we think stable bond markets – pretty much since the beginning of the year – are one of the reasons why equity markets can continue to edge up. Interest rates and yields appear close to equilibrium levels, a state of relative steadiness which enables activity to happen. However, these new equilibrium levels are not comfortable for everyone, and that difference seems to be driving change. We share our asset class performance round-up for February in a separate article below.
There were no big mergers or acquisitions last week, but the spate from the previous week has raised expectations of more to come. It is also noticeable that companies are increasingly trying to raise equity rather than loan capital. Bloomberg pointed out that companies are finding the near-term cost of equity much more bearable now that dividend yields have fallen in relation to bond yields. While the longer-term cost of equity might be high, the improvement in balance sheet metrics, in terms of credit quality, is often welcomed by investors who would usually complain about dilution.
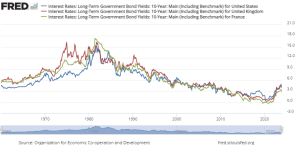
Interest rates and bond yields have stabilised, but are high, certainly compared to much of the 2010-2020 period. However, in the general scheme of history, they are very average. The graph below shows how yields have evolved here in the UK (red), in France (green) and in the US (blue) since 1960. The 10-year gilt is trading at a yield of 4.17% as we write, which is below the 6% levels prevalent through most of the 1960s before we got into the inflationary days of the 1970s.

Growth was higher in that period in Europe, as we went through the post-war rebuild. In the US, despite strong growth, yields were around the 4%-5% level, but rarely lower.
In the UK, yields averaged about 3.6% from 1785 to 1959 (according to data cobbled together by the Bank of England (BoE) in A Millennium of Macroeconomic Data for the UK, published in 2016), and ranged from 3% to 6%. Market mechanisms were much slower which may have restrained changes in rates, but there was not much volatility until we got to the 1970s.
So, although rates feel high now, they appear to be fairly normal when taking a longer view. They are a little higher than the very long-term, and about in line with the past 75 years. That history gives us comfort that an economy has functioned, and will function, in a reasonable balance at current rates.
What has struck us in recent weeks is that consumer and business behaviours have become sensitive to quite small changes in rates. Small businesses are negatively sensitive and step up efforts to reduce debt on any sign of a rise. However, there is demand for debt if the interest cost comes down in the mortgage market.
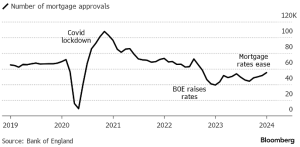
Nationwide Building Society reported that the average price of a home rose to £260,420 in February, up 0.7% from January and 1.2% higher than February 2023, the first annual growth since January 2023. Meanwhile, the BoE published mortgage approval data for the previous month (January), which showed 55,227 agreed mortgages. That figure was quite a bit higher than the 52,000 consensus Bloomberg gathered. Approvals have been rising for four months, and may well get back to the pre-2020 levels as the seasonal activity increases.

The mortgage dynamic is very interesting. Housebuilder Taylor Wimpey released rather so-so results for the full 2023 year, doing better than expected in profit terms but with a downbeat outlook for this year. They are probably being cautious, not surprising after the general run-up in housebuilder optimism at the end of 2023. The FTSE 350 Household Goods and Home Construction Index is up from the October lows by over 30%, albeit flat this past month.
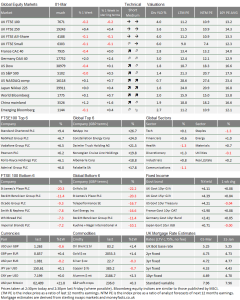
The driver has been the fallback in mortgage rates. While expectations of Bank of England (BoE) rate cuts have diminished in the past month, the mortgage war between banks has been raging on. We track mortgage rates for the weekly data table at the end of our musings (scroll to the bottom). Swap rates are the interbank rates which define the levels at which banks borrow in order to lend to new mortgagees. These have risen slightly but the offered mortgage rates have stayed very stable. Indeed, the spreads have gone from about 1% over swap rates to less than 0.5% and, last week, the best offered three-year rate was the same as the three-year swap rate.
What does all this tell us?
The BoE sets the rates at which it interacts with the banks. However, we all have differing borrowing needs and different interest rates that we can bear. The collapse in spreads between the swap rates (which are closely aligned with the BoE’s target rate) and actual mortgage rates tells us (we believe) the BoE is setting rates a bit high, but not far away from the rate that normal people can bear.
Banks have had deposit balances rising, but have found there’s not much borrowing going on. If they raise mortgage rates to customers by a small amount, demand disappears. The obverse is that there’s reasonably healthy activity if they cut. They are helped in that decision to cut by the fact that the credit quality of the new borrowers is good enough to warrant lending on skinny terms. Borrowers have reasonably strong deposits and little previous borrowing; they have good ongoing income, while the outlook for house prices has stabilised.
The market has found an equilibrium rate and credit demand appears to be ‘elastic’ or price-sensitive. This is also a stable dynamic which builds healthy loan books for banks and other investors, and solid dependable growth for constructors and the economy. The need for tight lending margins also suggests there is no room for rate rises and really that rates could be lower.
On Thursday (7th), the European Central Bank (ECB) conducts the first of March’s central bank meetings. Europe is in a very similar situation to the UK, and many businesses are still seeking to reduce debt levels. However, unlike in the UK, consumer/household demand for credit is low. The recent fallback in inflation will definitely spark a debate, but it is unlikely to result in any rate cut. The ECB’s researchers have published their “forward-looking wage tracker” which shows how they think wage rises are evolving on a monthly basis, and thereby provides some guidance on how much inflation pressure they expect is in the pipeline. The commentary from various council members has constantly referred to still-rapidly rising wages, and it does appear that the EU-wide wage growth remains around 4.5% (for comparison and perspective, the average wage growth was a little below 2% between 2011 and 2021).
The question which comes to mind is this: if wage growth is so strong, why is growth so anaemic? Inflation has now come down to 2.6% year-on-year, while JP Morgan has the current real gross domestic product (GDP) growth level at -0.6% annualised. The answer is, of course, that someone in the economy is saving or, more accurately, reducing borrowing; the corporate sector continues to deleverage and private households are not picking up the slack.
We think both the BoE and ECB ought to be on the verge of rate cuts. Growth is not collapsing, but neither is it rising. By focusing on labour pricing power alone, they miss the point that it is businesses that are paying that price. It is neither being funded out of money creation not reflected in rising prices.
As we said, unfortunately for yet another month, we will analyse words, not actions.
February 2024 asset returns review
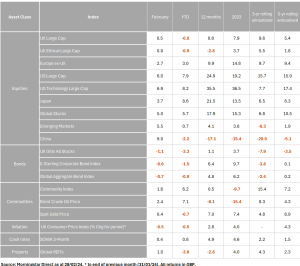
February turned out to be yet another strong month for global investors. Some mid-month pessimism about the state of the world economy caused a temporary lull in capital markets, but this was completely overcome as the month came to a close. In the end, global stocks added a very healthy 4.4% in sterling terms. The positive returns were widespread too, with every major region we follow finishing in the black. The fact February’s rally was so broad-based was a good sign, allaying previous concerns that too much capital was focused on the US mega-tech sector. The latter performed well last month – but so did many others – after investors started dreaming about a broad global economic recovery.
The table below shows February’s returns across major regions and asset classes.

The US was once again one of the strongest performers, with the S&P 500 jumping 5.2% in sterling terms. At the start of the month, there was much discussion around the artificial intelligence (AI) investment craze, and whether it is – or will become – a speculative asset bubble. This came to a head following Nvidia’s stellar earnings report, which showed revenue up 265% and profit up over 750% for the year, giving the chipmaker’s share price a massive shot in the arm. Euphoria seemed to peak last week though, and trading since has been much more muted.
By contrast, and as a welcome change, the Russell 2000 index, which includes smaller-cap US companies, has climbed steadily over the last week and a half. Stronger sentiment for smaller businesses signals that markets believe growth is coming. There was also a pick-up in US mergers and acquisitions in the US, a sign of changes in market composition. Fears still persist that a strong US economy would be too inflationary, preventing the Federal Reserve (Fed) from meaningfully cutting interest rates. But recent data suggests that US inflation is stabilising around the 3% level – which is consistent with a slight Fed easing in the summer or autumn.
These moves have helped bring confidence to markets. One clear sign of this is the US dollar, which climbed against a basket of other currencies in the first half of February, thanks to continued outperformance, but pulled back mid-month. A weaker dollar suggests solid global growth expectations. This was also reflected in bond yields, which weakened at the start of the month but subsequently recovered to recent highs.
The clearest sign of the sentiment shift driving capital markets over the past four months is China. After being in the doldrums for over a year, February saw a dramatic turnaround for Chinese equities, which gained an impressive 9.3% in sterling terms, making China the best-performing region for the month. The government’s failure to stimulate a meaningful economic recovery in 2023 had been the dominant story, but that negativity finally seems to have bottomed out, even if the recent gains have not even equalised the losses since the beginning of the year.
The world’s second-largest economy is still struggling in terms of hard data. Official figures say that Chinese gross domestic product (GDP) was 5.2% higher in January than a year before, but consumer demand is weak and disinflation is still present. The cause of the market turnaround is, once again, policy. Through the recent weakness, Beijing has held off using its ‘big bazooka’ of past downturns, but policymakers have now clearly moved to coordinated stimulus. There are signs this approach is bearing fruit too, particularly the cut to China’s housing prime rate as an attempt to bolster its ailing property sector.
China is a very important part to the global economy these days, having contributed more to global growth than any country over the last decade and a half. Investors hope a stronger domestic economy will stop the spread of disinflation and allow global manufacturers to regain their pricing power. Weak demand and goods prices out of China have been a decisive factor behind lower commodity prices. Accordingly, there was an upswing in oil prices last week, and the commodity index we track gained 1.3% in sterling terms through February.
Turning commodity prices might be a hindrance for Europe, which has benefitted greatly from weaker energy prices recently. A warmer-than-expected winter has meant that European natural gas supplies were once again not tested to the limits. European stocks gained a respectable 2.9% through February in sterling terms. So far, 2024 has been a steady incline for Europe, but as we have written before, the continent stands to benefit from stronger global growth. If the European Central Bank (ECB) is able to cut rates soon (and before the Fed) and Chinese demand comes through strong, it will be a potent recipe for growth.
The UK has unfortunately not had the same positivity. The FTSE 100 ended February with a 0.7% gain, ensuring a slight decline in year-to-date returns at -0.6%. Smaller British companies in particular – being more closely tied to the dynamics of the domestic economy – are having a hard time, with UK small-cap equities down 1.2% last month. The disparity between the UK and other markets – particularly the US – leaves UK equities with relatively attractive valuations, at least.
Growing positivity in the global economy is a welcome sign, as is the fact that returns are no longer solely focused on AI. The worry, as usual, is that this could mean returning inflation pressures and a delay in central bank easing. There is no sign of that yet, but we will keep a close eye.

If anybody wants to be added or removed from the distribution list, please email enquiries@cambridgeinvestments.co.uk
Please note: Data used within the Personal Finance Compass is sourced from Bloomberg/FactSet and is only valid for the publication date of this document.
The value of your investments can go down as well as up and you may get back less than you originally invested.


