Published
29th April 2024
Categories
Perspective News, The Cambridge Weekly
Share
The Cambridge Weekly –29th April 2024
Inflation, a common side effect of growth
Intraday equity market volatility is back, as the past roller coaster week showed. Still, we yet again seemed to end flattish after a busy end to last week
UK markets were strong, helped by the bid for Anglo-American from BHP. Anglo American’s share price rose to match the premium offered by BHP. Meanwhile, China is also managing to rise and, in Sterling-based terms, is now 15% above the lows of late January. The Hang Seng is even perkier, up 20%. The Japanese stock market has had a less happy time of late, falling over 7% from its peak on 22nd March, although it has still risen 1.5% since late January.
Part of this has been the different performance in their respective currencies. China’s renminbi remains only slightly weak, but the yen has moved to the lows of 1990. Last week, the Bank of Japan made no change to policy, ignoring the calls for some sort of intervention to halt the yen’s fall. The US dollar rose slightly against most currencies as well.
Last week was much calmer in geopolitical terms, fewer high-profile tensions between Iran and Israel, especially after the passing of the Ukraine/Israel/Taiwan aid package by US congress. That helped risk assets to find buyers and equity markets generally stabilised. However, the concerns are still strong, now mostly centred around rising bond yields.
The US 10-year treasury bond yield, regarded as the global bond yield yardstick, had moved down below 4.6% briefly but ends the week a little higher at 4.65%. Other bond markets have also seen rises, partly spurred by weaker currencies but also by fears about global inflation.
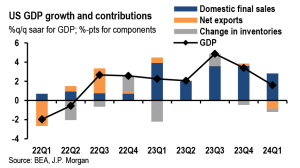
Last week’s main economic event was in the US, with the release of the GDP data for the first quarter. According to the preliminary data, US overall real growth has slowed to an annualised rate of +1.6% for the quarter, undershooting economist expectations of above 2%.
The headline real growth number rather disguises the important point that US consumers and businesses have continued to increase their spending at a fair tack. Domestic final demand was buoyant and remains above a +3% annualised rate.
Instead of producing the goods for sale, some of the sales were filled out of inventories. Also, for the first time in two years, the US economy imported more from the rest of the world than it earned in exports. When final sales (driven by consumption) are strong, it usually drags in more imports than exports, but this had not been the case for two years. As the chart from JP Morgan Research shows below, net exports have been a positive, even when final sales growth moved into a very positive state. Now, it has moved into a more normal position, but this only underlines the strength and health of final demand.

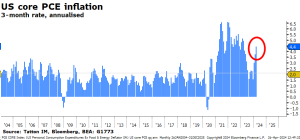
This means, however, that US consumption is strong enough to create a problem for the US central bank, the Fed. Inflation in the US has stopped falling, as evidenced by last Friday’s release of the personal income and spending data. Core prices in this measure were the same as last month on a year-on-year basis. The inflation measure known as the core personal consumption expenditure deflator is +2.8% year-on-year (one of the key inflation measures the Fed considers) but this represents a rate well above 4% over the past three months, heading back into deeply uncomfortable territory for the Fed, and way above their 2% target (see chart below).

This also presents a problem for the rest of the world. JP Morgan Research reported on their aggregation of the March CPI data across the world, saying that the annualised three-month growth rate for global headline inflation and core inflation picked up to 3.7%.
This is the third consecutive firm monthly gain, with continued strength in services prices (+0.45%m/m). But there was some good news as well, with core goods prices showing a small decline.
However, the fact that prices have started move back up faster, even where growth has been less strong, creates difficulties for the recently dovish central banks such as the ECB and the Bank of England. The ECB is likely to stick to the plan of cutting rates in just over two months’ time, but the members are making hawkish noises much like those on the Federal Open Markets Committee. The implication is that there will be a move in June, but then a delay before the next one.
This would make the global rate cutting cycle very different to others. Usually rates move quite swiftly downwards, typically about 2-3% over the year before bottoming. At the moment, the extent of cuts is expected to be about 1% for a full year in Europe. In the US, rates are expected to go no lower than 4.5%, less than 1% from last Friday’s levels.
Still, the major central banks have not returned to actively trying to discourage growth by raising rates (apart from the BoJ, and even they are being dovish). We have not got to the point where any policy maker is openly talking of raising rates. For that, we would need to see signs of rising prices coming through the supply chains.
The bid by mining giant BHP for Anglo-American is related to that inflation story. Copper prices have been moving up very sharply and we write below on the story. One aspect behind the rise is to do with AI. Artificial intelligence has been a market theme since ChatGPT burst into the mainstream nearly 18 months ago and has spurred huge gains in stocks associated with it.
Last week, we saw Microsoft and Google (aka Alphabet, although almost everybody has given up calling them by that name) bring good profit news, ostensibly because of AI impacts. Google also announced a $70bn share buyback program (we write about the spread of those programs as well, below). However, Meta (Facebook) took a share price hit because of its ambitious AI-related investment plans. They are likely to be hugely expensive.
Mark Zuckerberg spoke in an interview saying the costs are high because of supply chain bottlenecks. The issue is not chips, as those supply chains are largely sorted out. He was talking about building power plants to supply a gigawatt. That’s about the size of an average US nuclear power plant or 5 gas-powered plants. The amount of electric transport (copper) cabling is mind-boggling.
Still, pricing power is always good news for some stocks, such as Anglo American. And rate risks to markets are being offset by continued positivity coming from the US earnings season, which is in full flood, with few nasty surprises so far. The next big thing comes this week, with the Federal Open Markets Committee meeting on Wednesday. There’s a miniscule chance of rate moves, or at least some more guidance on when to expect them and under what circumstances, so all ears will be on Jerome Powell’s press conference. The rest of us can brace for another volatile week in markets.
Strangely, many of the conditions now causing volatility were present in the first quarter. Back then, yields were rising, and markets were expecting a global inflation rebound, but investors took it in their stride. Now that inflation has actually returned, markets realise they might have been overexcited, and price rises might be more serious and long-lasting than assumed. This means growth expectations will take longer to turn into actual profits, while the other headwinds that existed before are still annoyingly persistent (Geopolitics, financial pressures from elevated rates and yields, China’s demand deterioration).
That being said, the medium-term case for global growth getting back on track – the ‘back to mid-cycle’ outlook we wrote about before – is still unscathed. Constructive corporate earnings reports now being released show as much.
It may just be that markets got a little bit ahead of themselves – as they do – and are now experiencing a consolidation phase. It might look bad now, but it should recalibrate expectations to more realistic timeframes. Keep calm and carry on.
Buying back shares: growth strategy or accounting trick?
Good news for investors in UK equity: British companies paid out £15.6 billion in dividends through the first quarter of this year. That is a 4.9% jump from the previous quarter, and forecasted dividend growth for 2024 overall has climbed to 4.3% against the previously expected 3.7%. Corporate Britain’s reputation as a strong dividend payer is secure, but a few sectors saw declining payouts as companies instead decided to buy back their own shares.
Tesco recently announced plans to buy £1 billion worth of its own shares from investors over the next 12 months. It follows the buyback trend we are seeing in Europe. Earlier this month, Swiss bank UBS promised to buy back $2bn of its shares, while Dutch bank ING wants to release billions through a combination of buybacks and dividends.
This is interesting because large buybacks have, for a long time, been more of an American phenomenon. For the last few decades, US corporates have increasingly opted to give profits to shareholders by buying stocks in the open market, rather than giving out the money directly. According to S&P Global, in 1980 just 28% of US companies had share buyback programs, while 78% paid dividends.
By 2018, 53% had buyback programs and just 43% paid dividends. There is considerable debate about why this is and what difference it makes in terms of growing a company or bolstering its value. But the first thing to note is that the profits that go toward dividends or buybacks are, by definition, not directly supporting a company’s growth. Most companies want to put some of their profits back into growing the business, but that requires there being opportunities for growth. If there is not a good business case for investing or saving leftover capital, firms will give it to shareholders.
Dividends are the traditional method for this. Profits are just divided up and paid out equally per share. But if a firm buys back its shares instead, the shareholders that sell will get a direct payout, while the remaining shareholders should see the value of their stocks go up – as the increased demand for them, together with the shrinking number of shares outstanding, should drive up the share price. Since price is determined by the balance of buyers and sellers, and the added buying capital is just the profit, it should not make a difference to the value of investors’ holdings (cash plus stocks) whether a company pays dividends or buys stock. This is easiest to see if you invest on a total return basis, so any dividend payouts just go back into your equity holdings anyway.
That is the theory at least, but the reality is bit more complicated. For one thing, the tax implications are different. It depends on each investor’s situation and the tax rules they are under, but historically buybacks have resulted in less of a tax burden. That being said, governments are always keen to close perceived loopholes and so rules have changed as buybacks have become more prominent.
The more fundamental differences are in terms of earnings per share and what this means for perceived ‘value’. When a company buys its own shares, those shares are then cancelled, reducing the outstanding stock. That usually reduces the number of shareholders (though it might not, if everyone sold some of their shares in equal proportion, for example) which can streamline company operations. Importantly, it increases earnings per share.
Earnings per share is a hugely important metric, both for potential equity buyers and for corporate targets. So, this little accounting trick of reducing the base against which earnings are measured can lead to bigger bonuses for executives – which some people argue is an inefficiency – and better looking EPS growth numbers than have actually been delivered in total profit terms. In an era where investors are keener than ever on growth stocks, this trick might be the difference between a company having access to swathes of ‘growth focused’ investment capital or being relegated to the ‘value’ category.
Now, crucially, this should not make a difference to a stock’s valuation in terms of price-to-earnings ratio. Its price probably goes up from the buyback, but its earning per share goes up as well. If all shareholders were to continue to hold the same proportion of the company, the share price and earning per share will go up in equal measure, so the ratio between the two would stay constant.
If a company always uses profits to buy back shares, investors can only get a cashflow from the business by selling shares. Thus, at some point investors have to sell some shares when they have other needs. The selling pressure from those shareholders that need the cashflow means that the share price ought to rise slightly less, so the valuation (in terms of price-to-earnings) should go down slightly.
Nevertheless, it appears that buybacks create an “opt-out” decision for investors, whereas dividends create an “opt-in” decision. It seems reasonable to think that investor inertia will make it more likely that buybacks will mean more investors staying invested in that company, and that valuations will be higher for buyback stocks, at least until the valuations are high enough to create a strong incentive to disinvest.
The fact that US companies have historically been more keen to buyback than Europeans could be a factor in why US equities generally have higher valuations – though the main factor is undoubtedly long-term growth outperformance. Many investors believe a buyback program is a signal of better management in itself. It is likely that European firms’ increasing preference for buybacks over the last few years is in part down to emulating the American model.
According to a report from Goldman Sachs, share buybacks are increasing across all European sectors. Unsurprisingly, these moves are particularly prevalent among companies that have a lot of cash and relatively few growth opportunities. Ironically, in recent years, the value benefit of buying back instead of paying out dividends seems to have waned for US corporates – probably because everyone is doing it. But, since European firms are starting from a relatively low level of buybacks, there is a good chance they will benefit. Even if it is just an accounting trick, it could still be a good one to use.
China long on copper
The world’s largest mining company plans to swallow one of its biggest competitors. Last week, the UK headquartered Anglo American said it had received a takeover bid from Australian mining giant BHP, which is estimated to be 19% above analyst valuations. BHP’s motivations are reportedly all about copper: it wants the British firm’s copper mining access and is willing to deliver the biggest shakeup to the global mining industry in a decade to get it.
Copper is crucial to new technologies for the global green transition, and the metal is in massive demand right now. At the time of writing, S&P’s copper index is up 6% in April alone. It is one of the main reasons that S&P’s broad metal index has jumped higher this month, despite negative returns for other key commodities like oil. Indeed, metals are outperforming energy prices in 2024. We might think this is down to returning global growth optimism – particularly focused on the resilient US economy. As an industrial metal, copper prices do well when production and global inflation is expected to pick up.
Investors are certainly keen on the metal. Citi Research reported recently that copper funds have $36 billion in ‘long’ investment positions – buying the metal or its options in the expectation that prices will go up. That is an all-time high, and has helped push the price of physical copper to nearly $9,600 per ton, almost 22% up from mid-October.
Citi think copper prices could go even higher too. The demand for physical copper is underlined by the world’s decarbonisation efforts. The metal plays a key role in renewable energy and green technology, and with these sectors expected to grow dramatically in the years to come, the fundamental case for higher copper prices is strong. Overlaying that long-term story are shorter-term cyclical trends, like the expected pickup in global economic activity.
Despite funds betting record amounts on higher copper prices, the amount invested in ‘short’ positions – selling futures options expecting prices to go down – is also at a record $21bn. That means the market’s net positioning is still extremely bullish (around the record highs seen in 2021) but many investors are unconvinced or hedging their bets. Those bets could well drop away if copper maintains its upward trajectory, laying the ground for further price jumps.
That being said, the fact so many investors are buying copper is not to say that all the price optimism is justified – at least in terms of economic fundamentals. The long-term green transition might favour copper, but this trend has not been as smooth as it looked a few years ago, and other so-called green assets have had a harder time. Likewise, capital markets are generally positive about global growth this year, but we are still in a fairly weak phase and the ‘lower rates, returning growth’ narrative has been challenged in recent weeks.
In these situations, it is useful to look at where copper demand is coming from. If price action was a progrowth story, we might expect the strongest demand to come from the US – considering that is where growth and reflation look likeliest. However, one of the biggest swing factors for physical copper demand this year has been China. That is despite a still weak domestic economy and doubts about China’s trading prospects with the US.

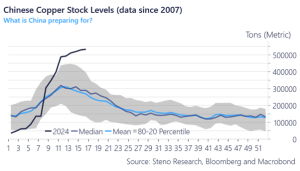
Chinese manufacturers generally front load their copper purchases to build stocks for the year. But as the chart above shows, even relative to seasonal trends going back 17 years, China’s demand for copper has been enormous this year.
This is almost certainly a defensive move, rather than optimistic positioning. We wrote recently about the impressive rally in gold prices this year, and how Chinese demand for physical gold was a massive component. In that case, Chinese individuals want to protect their wealth from an overzealous government and a potential drop in the value of the renminbi.
We suspect something very similar is happening with copper. As we wrote before, the People’s Bank of China (PBoC) has been officially maintaining the renminbi’s exchange rate band against the US dollar, but allowing its currency to trade right up against the limit. In the past, this behaviour from the PBoC has preceded a drop in the target dollar exchange – as in the infamous devaluation of 2015.
Since metals like gold and copper are priced in dollars, a renminbi devaluation would mean copper becomes massively more expensive for Chinese firms. So, buying reserves of physical copper now makes sense if you think your currency will drop – even if copper’s dollar price is extremely expensive in absolute terms. A lot of this copper buying will be companies wanting to use those reserves, but this situation also encourages speculative buying. Speculative Chinese buyers might want to buy hold reserves in expectation of a currency devaluation, after which they can sell to Chinese manufacturers at elevated prices.
So, much like with gold, the short-to-medium-term outlook for copper prices is heavily dependent on what the PBoC does. If it does devalue the renminbi, it will mean significantly weaker demand from China, and hence not much more upside for prices. But the longer it holds off – particularly with the currency looking vulnerable – nervous Chinese traders will probably keep up their demand.

If anybody wants to be added or removed from the distribution list, please email enquiries@cambridgeinvestments.co.uk
Please note: Data used within the Personal Finance Compass is sourced from Bloomberg/FactSet and is only valid for the publication date of this document.
The value of your investments can go down as well as up and you may get back less than you originally invested.


