Published
19th February 2024
Categories
Perspective News, The Cambridge Weekly
Share
The Cambridge Weekly – 19th February 2024
UK not growing really, not growing nominally
As regular readers will know, we tend not to comment on UK matters as much as some, partly because the investment portfolios we manage for UK clients are quite globally focused. But the UK as our home is important to us and last week we had an enormous amount of important domestic information. And, of course, the upcoming Spring Budget and General Election potentially later this year will affect us all. We write on the fiscal dynamics in a separate article below.
The UK is in a technical recession, defined as two quarters of real growth contraction (‘real’ = after subtracting inflation). There is much discussion about whether this is really a recession, what that means for public policy and, of course, what it means for the election.
October-December gross domestic product (GDP) came in at -0.3% quarter on quarter, or an annualised
-1.4%, worse than the consensus of -0.1%. The previous quarter’s growth rate was unchanged at -0.1% and that means economists talk of a recession. The most recent data is skewed down by health worker strikes (exacerbated by the problems of accounting for the value of public sector activity) and other one-offs (we hope), like bad weather hindering construction, but growth has been weak for a year. From a 12-month perspective, the 2023 Q4 GDP value has now fallen below the 2022 Q4 GDP reading, confirming a flat- lining 2023 UK economy.
Sam Tombs of Pantheon Macro – a well-regarded UK economics consultant – tells us that GDP will return to a rising path in 2024, and that the Bank of England’s Monetary Policy Committee (MPC) needn’t panic about collapsing activity. He calculates that households have started to save more after wild swings during and immediately after the pandemic, and thinks this comfort buffer will push up consumer demand as wages will be rising more than inflation.
Sam has a point. This same dynamic appears to be underway in the US, where robust households have been a big component of the continued resilience of their economy. Meanwhile, last week’s release of UK jobs market December data showed surprising tightness. The unemployment rate fell back to 3.8% rather than the expected rise to 4%.
We have mentioned before that the quality of official UK economic data has worsened, but not because the Office of National Statistics is doing a bad job. Firms, agencies and people are not responding to requests for data as they did in the past. We can all come up with reasons why this might be the case, but it doesn’t alter the fact that we cannot rely on at least some of the ‘facts’ as we used to.
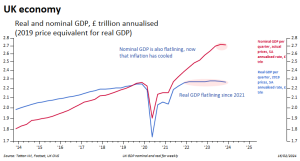
Both labour force data and GDP data are suspect, but price data are a bit more reliable and that leads to another point. The measure of prices used to compute GDP data on a real basis is called the deflator and differs from the more usually quoted consumer price indices. Last quarter’s deflator growth was very low at less than +0.7% quarter-on-quarter annualised, indicating that nominal growth is now very weak as well.
This marks a change which we think the MPC will (or at least, should) take seriously. The base rate is at 5.25% and has looked high relative to near-constant 0% real growth; the GDP level of about £2.2 trillion (in 2019 money) has not changed for two years – in other words, real growth is at zero. Indeed, the real level is now below that of a year ago, not just two quarters. The high base rate was justifiable only when total current activity growth (‘nominal’ which includes inflation) was growing strongly. Now, nominal growth is barely changing and has been nearly the same level for the past three quarters.
Research through the past 20 years has suggested that a central bank reaction function should not be ‘symmetric’ in the face of an economic contraction. Compared to growth-phase tightening, a contraction- phase easing should be quicker or more aggressive or both. That’s easier said than done because evidence tends to be of lower quality as contraction begins (such as now?), and also committee-based decisions tend to be slow unless there is strong leadership.
The market is pretty convinced that cuts will have happened on or by the 20th June MPC meeting. There are meetings beforehand on 21st March and 9th May. As you can probably tell, we think there is enough fuel for a rate cut now, but the dynamics of the MPC are not conducive for a 0.25% cut, but it is possible. In the 1st February meeting, two MPC members voted for a rate rise, one for a cut, and the other six for no change. And, as we point out in the UK fiscal article this week, there is a high probability that tax cuts will happen on 6th March and that the ensuing small fiscal boost might lead the MPC to delay.
A number of emerging market central banks have already started easing rates, but developed markets are being dominated by the path of US rate expectations. Perhaps the similarities in tightness of labour markets in the UK and Europe might cause one to think this is reasonable. Yet the paths of domestic inflation and money supply growth are differing enough to suggest that the European Union and the UK will have to forge their own path, and that the US be stuck at higher rates.
Aiding this view, the European Commission published its forecasts last Thursday (15th February) which were downbeat. The Eurozone is now expected to grow just +0.8% for 2024, down from +1.2% in its autumn forecast. Inflation is expected to fall from +5.4% in 2023 to +2.7% in 2024, lower than the autumn forecast of +3.2%.
The Financial Times quoted Paolo Gentiloni, the EU’s Economy Commissioner, thus: “The rebound expected in 2024 is set to be more modest than projected three months ago, but to gradually pick up pace on the back of slower price rises, growing real wages and a remarkably strong labour market.”
Meanwhile, for Europe and the UK, energy prices are a big factor in business input costs. The rise in oil prices might make one think things are going badly, and that energy costs are rising. The good news is that natural gas prices continue to decline, and that is a decisive factor in the downswing in electricity prices. This will benefit manufacturers as long as demand holds up. Signs are that manufacturers are feeling less awfully negative, but there’s a long way to go to get to outright positive. Part of the story ought to be that central banks recognise the declining inflation environment and don’t allow real interest rates to become higher through neglect.
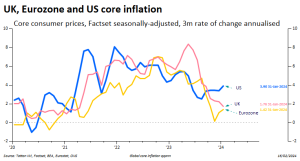
The divergence in US and European paths picked up some more evidence with the US January inflation data. US inflation surprised on the upside with core inflation rising again and by nearly 1% in three months, resulting in an annualised rate of just under 4%. This compares to Europe and the UK where we calculate the three-month annualised rate of change to be less than 2% for both as the chart below shows:
This divergence is at the heart of yet another rebound in 10-year US Treasury bond yields to above 4.3%, while Europe and the UK yields are more static. But because most of the rise is due to inflation expectations, US real yields have risen only slightly. We tend to think that equities are most impacted by changes in real yields, so this episode of rising US yields is not having much effect on the equity market.
Indeed, as we approach the end of the quarterly corporate earnings season, analyst expectations of earnings growth have taken another step up, and the S&P 500 has now more solidly broken above 5,000. The good news is that despite the differing real yield dynamics, other equity markets are following suit with the FTSE 100 at 7,700. Even China managed a substantial gain of 5% during the start of the year of the Dragon. Happy New Year!
The anatomy of asset bubbles
The artificial intelligence (AI) driven tech stock rally has been nothing short of extraordinary. Since the release of ChatGPT in late 2022, the tech-heavy Nasdaq index has gained nearly 50%. Making that rally all the more impressive is the fact that capital markets in general went through some testing times against a backdrop of slowing global growth, and the sharpest interest rate rises in a generation. As in any bull market, sustained price increases make investors nervous that stocks are, or will soon become, overvalued. But AI- related companies keep pushing ahead, with the Nasdaq already up 6.6% year-to-date at the time of writing.
No stock encapsulates the AI fever better than Nvidia. The world’s leading producer of AI-specific semiconductors is at the centre of virtually all the growth in AI technology, and the company’s reward from investors has been astronomical. Its share price is up 51% since the start of 2024, and up 217% in the last 12 months. If you had bought Nvidia stock in 2019 and held on, your stake would currently be up 17-fold.
Naturally, warnings of an AI bubble abound in financial media. Commentators have compared it to the dotcom bubble during the late 1990s and early 2000s. Both were driven by new technologies that were undeniably transformative, but whose implications and timing of commercial impact were extremely difficult to predict in advance. Picking stock market winners from structural shifts in technology is, therefore, very hard, so both episodes saw investment being thrown at companies without a firm grasp of their future earnings.
Knowing whether AI is now a bubble requires an understanding of what bubbles are, but this is a notoriously difficult concept to define concretely. In abstract terms, the standard line is that bubbles occur when asset prices systematically deviate from their fundamental value. This is characterised by a sharp rise followed by a sudden drop. Dutch tulip mania in the 1600s and the British South Sea bubble a century later are the stereotypical examples. Dotcom and the subprime mortgage crisis are more recent classics.
The trouble is that ‘fundamental value’ includes unobservable factors like future earnings. To know whether the current price is overvalued requires knowing how the company will fare in the future. But if we could know that for sure, no one would invest in bubbling assets in the first place, and hence bubbles would never occur. That is why concrete examples of bubbles can only ever be identified in retrospect – and even then, it requires complex statistical work and a lot of debatable assumptions.
How do bubbles inflate?
One of the key debates is over the mechanism that blows up bubbles. Behavioural economists suggest that asset prices increase far above underlying value because traders’ sensitivity to the actions of others overwhelms their judgements of fundamental value. This is usually attributed to human cognitive biases, sometimes called ‘irrational’ decision-making. These explanations became popular after the Global Financial Crisis (GFC) of 2008, when many became disillusioned with standard neoclassical economics and its apparent commitment to unrealistic ‘rationality’ assumptions.
On the other hand, many argue that bubble behaviour is a perfectly rational response to trading under uncertainty. If an independent AI expert tells you that some new chip design is going to revolutionise the industry, you have every reason to believe them and it seems reasonable to back that belief up with some investment. If later you see many people rapidly buying something they perceive as more valuable than the current price – and you have no special knowledge about what the true value is – it seems reasonable to think they might have a point.
This is the so-called ‘bandwagon effect’, and it is not inherently irrational. In the early stages of the dotcom bubble, investors were rightly optimistic about the future of e-commerce. Indeed, some of the companies that seemed overvalued – including the likes of Amazon and Google – went on to be huge winners and pay back investor confidence many times over. Investors did not start by blindly throwing money at any start- up with the right buzzwords, but by trying to discern which companies would be successful in the future.
The problem was that, with limited information, the simplest way of judging which businesses might be successful became the price itself. Again, there is nothing inherently wrong with using prices as a signal of information – but after it became the main signal a feedback loop started. In the end, the sum total of investment in dotcom companies exceeded any possible returns, and once people realised this – and crucially, the cost of capital increased from interest rate rises – fears of overvaluation were realised.
Do bubbles always burst?
Right now, it is clear that at least some US stocks are overvalued compared to historical price-to-earnings ratios or other regions. This is not just about AI but, as we have discussed before, also the longstanding bias from global investors toward American stocks. But the cohort of highly valued companies – the Nvidias of the world – is much smaller than the broad market positivity seen during the dotcom era. One key reason for that is just that central banks have spent nearly two years draining markets of excess liquidity, a process that was well underway when the AI boom started.
The biggest fear with bubbles – indeed, the reason people call them bubbles in the first place – is that they will suddenly burst, leaving investors with severe losses. But many instances that are often called bubbles, like the commodity boom of 2013-14 or the post-GFC ballooning of Chinese credit, were characterised by more of a gradual decline. Even if the current AI craze is a bubble, it could fizzle out or gradually unwind. That might take some time, and in the meantime, AI investors may well be in for some more stellar returns.
Crying “bubble” is easy, but when it comes to actually making investment decisions, we have to base them on more than valuation vertigo. Indeed, pessimists are just as prone to mistakes or biases as optimists. The key sign for telling when prices are turning is when highly valued assets start becoming more volatile. Currently, there is little sign that Nvidia and its cohort are going through that. And while they are not, it does little good not to own companies with undeniable huge earning potential.
It should also be noted that two further features repeatedly observed as bubbles approach their apex are not yet apparent. These are excessive leverage through layering of financial vehicles (Trusts of trusts, CDO2) and/or sky-high valuations of asset pools whose investment purpose is yet to be defined in more detail than just whatever the respective bubble’s area of activity is (South Sea trade, internet app, crypto activity, SPACs to name a few of the past).
This is not to say that all is well. US stocks, particularly the mega-tech sector, are extremely expensive even if they have solid fundamentals. The best strategy for the long-term, as usual, is diversification. We have to keep an eye on AI stocks, and particularly their volatility. But without any glaring warning signs, there is no reason to think things are about to burst.
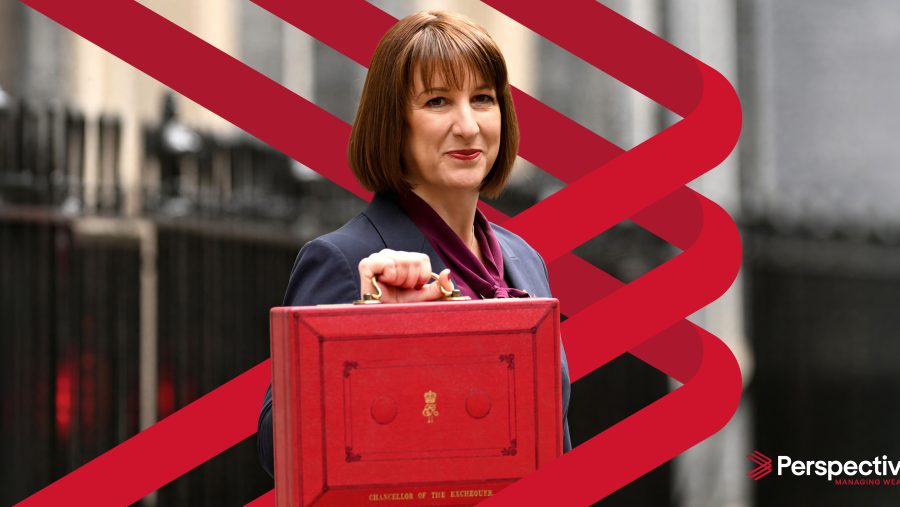
The UK’s fiscal bind tightens
With the Spring Budget fast approaching, tax cuts are reportedly top of Chancellor Jeremy Hunt’s agenda. According to multiple news outlets, these giveaways might have to be funded by additional public spending cuts – though the latter would likely be delayed beyond an upcoming UK election. Analysts at Morgan Stanley expect Hunt to announce a £15 billion package, mostly focused on income tax cuts and “fiscal easing now, spending cuts later”.
The need for a pre-election offering, means cuts are likely even if the Office for Budget Responsibility (OBR) says public finances are tight. The fiscal watchdog said Hunt had £13 billion of fiscal headroom against his own borrowing and spending targets back in autumn, but a large chunk of that headroom has been wiped out by rebounding bond yields – around £8 billion, according to the Treasury’s own estimates.
While the government might be willing to test the OBR’s predictions, Hunt will not want to do anything that might get in the way of Bank of England (BoE) interest rate cuts. To keep on track for falling rates by the end of spring, Morgan Stanley expects no large-scale fiscal moves. They expect the £15 billion tax cut to boost Britain’s growth by a mild 0.2-0.3 percentage points. That means the UK is still likely to have the largest fiscal consolidation – debt and deficit reduction – of any major economy this year.
Even so, the UK will almost certainly need to tighten fiscal policy more after the election. The Chancellor has made it his mission to restore stability and credibility to public finances following the crash and burn of Liz Truss’ ‘mini budget’. Regardless, the OBR has called the government’s post-2025 spending plans “a work of fiction”.
This is why no one thinks tax cuts will stick – even if the Conservative Party manage to cling to power in the General Election. Morgan Stanley thinks that just to stabilise outstanding public debt at current levels, the government would need a primary budget surplus of 1.5% of GDP, something that hasn’t been achieved since Tony Blair’s first government in 1997. Stronger than expected growth or interest rates falling faster than predicted might change that, but enduring weaknesses in the UK economy make both of those unlikely.
According to the Institute for Fiscal Studies (IFS), Britain is in a fiscal bind and needs tough action. High public debt means spending is severely constrained which, in turn, means that public institutions are stretched thin. These institutions might just about cope in normal times, but when shocks and crises break, there is no more capacity to pick up the slack. This can be clearly seen in the long-term stresses on the National Health Service (NHS), for example.
Debt accumulation is not as big a problem when the economy is growing, but growth has been weak over the long term (see chart in our lead article at the top this week). UK living standards have been stagnant for an unprecedented amount of time, taxes are at record historical levels (albeit still relatively low by European standards), and public service provision has deteriorated in the last decade and a half. The OBR’s forecasts already factor in higher taxes and deeper spending cuts, but that will only stabilise rather than reduce the debt-to-GDP ratio.
Currently, overall day-to-day spending is planned to grow by 1% in real terms per year, but the NHS alone will eat up more than that. Even with a 1% total rise, increasing the health budget by more than 2.25% per year requires making overall cuts elsewhere. If the total budget were to be fixed, a rise in the health and social care budget of 1% sees everything else fall by 0.8%. Yet a 1% increase in the Home Office budget, or in central government support for local government, would have little impact when shared across all other budgets.
Tight funding makes budget rebalancing extremely difficult. The Labour Party has said it wants to divert more funds to preventative services if elected, but doing so would either mean spending increases or cuts to non-preventative services – neither of which politicians are willing to do. Whether money is being reallocated across departments or to different regions of the country, rebalancing will inevitably mean short- term costs that no one seems willing to bear.
Again, these decisions would be so much easier if the UK could generate strong growth. That needs investment in productive sources – both public and private. But according to Oxford Economics, the UK’s public and private investment over the last three decades ranks 32nd out of 34 major economies. Only the severely constrained economies of Argentina and South Africa see less investment as a percentage of GDP than our 17.4%.
Unfortunately, the dire state of public finances means investment is likely to fall in the short term, rather than rise. Both Labour and the Conservatives have made promises to increase or incentivise investment, but these plans are usually the first to go when confronted with difficult budgetary decisions – as seen in Labour’s abandonment of its green investment targets. These moves stave off short-term pain and, hence, might increase electoral chances. But they make the longer-term problems worse.
Greater investment requires more financing, which could mean interest rates staying higher for longer. That could lower consumption in the short term, though even the short-term pull back might be counteracted by fiscal multiplier effects. The latter is exactly what we now see in the US, but the UK’s geography and demography might be a barrier for the same. For example, campaigners Britain Remade estimate that new rail projects cost between six and eight times as much per mile as in France or Germany, lowering the productive output of rail investment.
The IFS suggest that regulatory changes, particularly around taxation, could be much more effective. It argues that the current tax system distorts incentives and holds back growth, and could be reformed to better suit the country without lowering the overall level of taxation. The changes it suggests might work in principle, but would face many political barriers – such as the removal of Stamp Duty and reforming the Council Tax system. Addressing Britain’s long-term malaise requires bold changes – but these are extremely hard to implement thanks to a cocktail of fiscal and political realities. Heading into an election, both parties are preaching caution when courage is arguably needed more. With finances already so tight, politicians will have to confront these issues sooner rather than later.
Potential budget tax changes (as of 8th February):
Morgan Stanley posits some possible actions:
Income tax/National Insurance Contributions (NICs):
A general 1p income tax cut at a cost of ~£7 billion per year (with, possibly, more cuts to the top rate) possibly combined with…
- A 1p cut to the basic rate of NICs at a cost of ~£5 billion per This is cheaper than income tax cuts as it does not benefit pensioners. The government cut the employee NICs rate by 2p in the November fiscal statement possibly combined with…
- A personal allowance uplift at a cost of £23 billion if the uplift was in line with September 2023 inflation. Currently, both types of thresholds will be frozen in April (again, rather than rising by 7% in line with inflation).
- Inheritance tax (IHT) changes: Capping Agriculture and Business Relief, bringing pensions into estates and abolishing the residence nil-rate band would raise £4.5 billion in revenues that could be used to fund an increase in the nil-rate band to £500,000 or a cut in the IHT rate from 40% to 25%. An outright cut in the headline rate of IHT to 20-25% would cost £4.5-£5 billion per
- Stamp Duty Land Tax: Extending the raised thresholds from £125,000 to £250,000 to March It is due to fall back to £125,000 in March 2025. This would cost ~£1.5 billion for a year.
- Fuel duty: A freeze costing ~£4 billion for a It is set to rise by retail price index (RPI) inflation (probably about 5%) in April.