Published
15th April 2024
Categories
Perspective News, The Cambridge Weekly
Share
The Cambridge Weekly –15th April 2024
What the return of volatility tells us
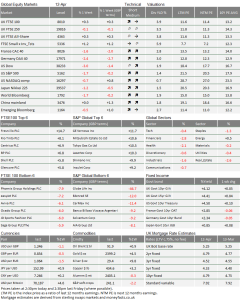
The past week has seen quite large price movements in asset markets even though, overall, equities are relatively stable. The UK’s main market index, the UK Large-Cap index, is higher and among the better index performers globally. It came very close to closing above 8000 last Friday, but just missed out (our table at the end shows the level at 2:30pm). However, bond yields are higher here and especially in the US (which means bond prices have gone down), which usually drags down equities. What stood out last week is that the reverse is true in Europe: equities are lower, but government bond prices are higher.
As we have written here recently, the first three months of this year saw declining volatility across asset classes, and this helped risk assets to rise in price. Why is it, then, that last week’s increased volatility did not hurt riskier assets more?
In the US, there still seems to be a “buy-the-dip” mindset among many equity investors. For us, this suggests that US investors still have relatively high levels of cash assets and like to deploy them when prices drop. However, it also suggests that the markets are getting riskier, with some evidence that the cash balances actually may not be that far from historical norms. Meanwhile, valuations are very high in some stocks, but the cheaper stocks are not that cheap. They are justified if economic growth is strong, but the US Federal Reserve (Fed) may not be prepared to allow that pace of growth. It may be inducing too much inflation.
Quite sizeable swings in the main equity indices have occurred in the past two weeks, sparked by signals of stronger than expected nominal growth, which pushed expectations of rate cuts further out into the future. The decline seen recently even happened before the previous week’s strong employment report, but then strong investor flows came to the rescue in at the end of that week. Last week, US inflation data was stronger than expected, with core CPI rising to 3.8% year-on-year rather than continuing its decline. This is yet more evidence for continued economic expansion, close to or perhaps even above capacity of their overall economy.
The US bond market has certainly taken note of the combination of strong growth and inflation. The yield on the US 10-year government bonds rose as high as 4.59%, for the first time since last November. While investors generally think that the Fed will cut rates sometime this year, the probability of a cut in June, as implied by market pricing, has fallen to just about 30%.
The rapid rise in US government bond yields to new cyclical highs during the late summer and early autumn of last year coincided with the last meaningful pullback in broad US equity markets. However, bond yields had been creeping up before, and equities did well. For markets, as long as the interest rates are not seen as holding back economic growth, or even threatening recession, equities definitely remain a good choice. So, the current repeat of rising yields in tandem with generally rising equity valuations in US markets suggests that the overall rate of real economic growth is not considered at risk, despite what appear to be high interest rates.
Undoubtedly, not everybody is doing brilliantly. The US National Federation of Independent Business, a small business association, released its well-respected monthly sentiment survey for March last week. It showed some despondency about future profits and the worst outlook in 10 years. Small businesses’ inflation concerns were previously coming down, but respondents are worried about inflation again.
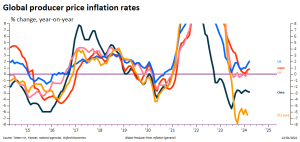
However, manufacturers are feeling better than last year and getting back to growth, according to the ISM Manufacturers Survey which came out last month. And we might infer from US producer price inflation that they are getting some pricing power back. March’s +2.1% year-on-year rate was actually slightly below economists’ expectations, but the direction of travel is strength rather than weakness.

For US businesses (especially the larger ones) profits appear to be on the rise, thanks to reasonable revenue growth and an ability to maintain margins. Indeed, the combination of improvements means that analysts have been raising their estimates for “next-twelve-months” profits on the S&P 500 at a 10% annualised pace for much of this year. Historically, that’s achievable, but the 20-year average is about 6% and periods of better growth tend to occur only following a sizeable downswing in profits, which we have not had.
Bloomberg Intelligence tells us that the Mag-7 (the US tech behemoths) are “projected to rise nearly 38% y/y, while profits will decline about 2% for the rest of the S&P 500. The group will command superior growth throughout the year, analysts project”. That statement might suggest that future profit expectations outside the Mag-7 had been bad but “next-twelve-months” aggregate estimates have risen about 6% since May last year, and picked up in line with the total index since the start of this year.
All-in-all, our observation is that mild growth optimism is fairly widespread, and nominal growth itself is showing up in the economic data. Indeed, it is widespread enough to mean that few are under pressure. A few companies, like Nvidia, feel great.
Still, growth may get too hot for the Fed’s comfort. While this is not the roaring twenties, the economy’s momentum has started to pick up from already decent levels. Few (apart from Larry Summers) have said that they should raise rates, but neither the market nor the Fed may be able to stand another rise in CPI.
European company analysts do not share their US counterparts’ optimism, and neither does the European Central Bank (ECB) have the same problems as the Fed. While the US and Europe have similarly tight labour markets, the differences in the corporate sector are stark. Therefore, in their meeting held last week, the ECB made it clear that rates will start to be cut in June. They continue to look through the labour market’s potential inflationary drivers and focus on the pressures that companies are facing, especially in weak revenue growth. Returning to the reverse market dynamics of Europe versus the US, divergent economies were well reflected in the market reactions last week.
European analysts might be starting to raise earnings projections (which have risen about 6% annualised from projections a month ago), but this follows nearly six months of projections declining at a 4% annualised rate.
The producer price data (shown in the previous chart) is probably good evidence for this. Manufacturing has faced huge pressures, still battling higher energy costs, while facing possibly unfair competition from abroad. Last week, the European Commission published a mammoth 700-page report on the effect of Chinese trade practices on Europe, essentially proving that China is dumping products because of politically- led, rather than market-led, production quotas. It highlights that Europe’s open markets have led it to feel quite extreme pain, especially in areas like electric vehicles.
Perhaps it also shows that the US tariff policy has protected its economy, but almost certainly concentrated the pain in Europe, highlighting the differing paces of political decision making (as if the need for a 700-page report didn’t do that as well).
Europe has little choice but to impose trade barriers like the US. However, this will be more difficult to enforce than in the US, given Europe exports more of its own goods (machines, cars, luxury goods) to China. One also wonders what this will do for China’s own policymaking. They have relied on external demand to support their economy while saying that they wished to expand domestic demand. However, President Xi’s philosophy is antithetical to individual consumption. There are anecdotes of many shops closing in the major city malls because spending appears so lacklustre. We write in a separate article about how the rise in gold prices may be linked to Chinese consumers and the path of the Chinese Renminbi currency.
Is Gold now an alternative currency?
Since the beginning of March, gold prices have been roaring higher, gaining about 17.5% in US dollar terms. This makes the precious metal one of the best performing assets of 2024 so far. At the time of writing, it is trading at an all-time high of $2,414 per ounce. The media has pointed to upcoming interest rate cuts from global central banks – most importantly the US Federal Reserve (Fed) – as well as rising tensions in the Middle East as reasons for the latest leg up. Gold is considered a safe haven asset or alternative to cash, so it tends to see more buyers when perceived risks are high or inflation threatens to diminish the value of currencies.
This goldrush is a little odd for that exact reason, though. International exchanges or benchmarks price gold in US dollars, so it is often considered an alternative to the US dollar or its assets. But even though rate cuts are expected in the middle of this year, the return on US dollars – in other words, the interest rate – is still extremely high by recent historical standards. Likewise, equities have been extremely strong all through gold’s recent rally, so there is little sign of worried investors flocking to the metal as a safe haven.
Of course, the fact gold is usually priced in US dollars does not mean it is an alternative to the US dollar alone. Indeed, the notion of gold as a cash alternative is arguably more keenly felt in countries with more volatile currencies. Zimbabwe, for example, officially introduced a new gold-backed currency last week to fight runaway inflation. The ZiG (Zimbabwe Gold) is the nation’s sixth attempt at establishing a new currency since 2008, and is backed by Zimbabwe’s gold and other mineral assets.
Zimbabwe’s central bank is not the only one keen on gold right now. The People’s Bank of China (PBoC) and the Reserve Bank of India (RBI) both recently announced they were building their gold reserves. The central banks continue to buy huge amounts of bullion, even with prices setting new records every day. Indeed, the world’s emerging nation central banks have been building their gold reserves (replacing the US dollar) since developed nations began using financial system sanctions as a wider sanction policy tool in the wake of Russia’s invasion of Ukraine.
However, perhaps a more important driver of demand has been that Gold has long been a popular cash alternative for China and India’s rapidly growing middle classes. Increasingly, for Chinese individuals, gold has also become a way of moving money abroad or hiding it from an overzealous government. Younger Chinese are now buying into gold too: small gold beans are reportedly a bestseller in jewellery shops across China, marketed as an entry level investment for young people.
Despite recent signs of improvement, the Chinese economy is suffering from malaise. The world’s second- largest economy is in a period of deflation (a nice problem to have, we might think in the West). China’s stock market has been very volatile through this period too, which might push investors toward perceived safer assets such as bank deposits, were it not for available rates being close to 0%.
Perhaps the most important driver of Chinese gold demand is the state of the property market. In China, property has been the usual channel for savings in real assets. But the property crises of the past four years have fundamentally shaken the Chinese belief that real estate assets were immune from the actions of government. The start to 2024 has seen yet another decline in prices. This seems to be a big driver of the current demand for physical gold.
Of course, concerned Chinese citizens will only put their savings into gold if they believe it to be of decent value and a growth prospect for them. But, the PBoC has been helping with this too. The renminbi’s value against the US dollar has held up reasonably well this year, given the downward pressure one might expect considering the differences in interest rates and inflation between the US and Chinese economies – not to mention the selling pressures from Chinese citizens trying to move money abroad.
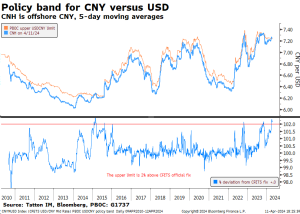
This relative stability has largely been down to the PBoC maintaining the RMB’s currency trading band against the US dollar (China keeps its currency loosely pegged to the dollar). The PBoC fixes a target exchange rate each day, then allows a 2% trading band around that midpoint fix. It keeps exchange rates within this band by utilising its very considerable foreign exchange reserves. China has by far the largest reserves of any country – almost three times as much as second on the list, Japan.

In recent months, though, we have noticed an interesting trend. After a very long period of keeping the RMB around the midpoint of its target range, the PBoC has this year allowed the currency to edge toward the top of the band. As the chart above shows, it is now right at that 2% limit, breaching it on occasion, with little sign of changing.
The last time that China’s currency was allowed to consistently hit the top of its target range was right before the sharp and sudden devaluation of 2015. Many commentators think this is a sign we could be in for another devaluation. This is not just because of historical precedence; dropping the currency value against the US – China’s biggest trading partner – would give Chinese exporters a competitive boost, which could help spur the nation’s deflationary economy.
One of the reasons the RMB is at the weak end of its band is domestic selling pressures from Chinese citizens. The appetite for gold needs to be seen in that context, given Chinese savers fearing imminent devaluation of their currency may want to put even more of their renminbi savings into US dollar denominated gold. Therefore, if the PBoC maintains its current band and target, it could push gold even further, particularly once we get to actual Fed rate cuts. But if the PBoC does devalue, that could deprive gold of a key source of demand. Gold prices might struggle to climb higher in that case.

If anybody wants to be added or removed from the distribution list, please email enquiries@cambridgeinvestments.co.uk
Please note: Data used within the Personal Finance Compass is sourced from Bloomberg/FactSet and is only valid for the publication date of this document.
The value of your investments can go down as well as up and you may get back less than you originally invested.

