Published
14th February 2024
Categories
Perspective News, The Cambridge Weekly
Share
The Cambridge Weekly – 12th February 2024
Are US stocks bubbling up?
Last week the US large-cap equity market shook off the rest of the world and marched to yet another new milestone. The S&P 500 traded above 5,000 for the first time on Thursday night. It also shook off another rebound in bond yields, back to recent highs. China managed to generate a gain just ahead of the Chinese New Year with yet more policy action, while Xi Jinping publicly committed to supporting the Chinese economy. Europe and UK stocks and bonds generally marked time, although there were notable exceptions.
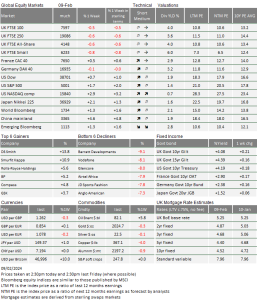
For example, the best performing UK-listed company last week will not appear in our table of the FTSE 100 best and worst (found at the end of the weekly). This is not an error (on our part, at least). ARM Holdings PLC, nevertheless, is a UK-registered company and world-leading designer of computer chips, which on Thursday saw its share price rise 50%, following its fourth-quarter results. ARM projected revenue for this current quarter to be over $850 million, way above analyst projections of $778 million.
ARM became publicly traded on 13th September 2023, when owners SoftBank of Japan, launched an initial public offering (IPO) for about 10% of the company on the US NASDAQ exchange. The shares are traded using an American Depositary Receipt (ADR), and one UK share of ARM is held in one ADR. At the time, the value of the floated part of ARM was at just below £4 billion, which would have put it around 80th in the FTSE 100 in terms of market capitalisation. If all the shares had been sold, it would have ranked 14th.
From the same 100% perspective, as of Thursday night, it would be the fifth largest, just below BP. For such a large company, a move of this magnitude is remarkable but not without precedent. Nvidia in the US last year saw a similar trajectory. Both are in chip design (ARM licences all of its designs while Nvidia designs and produces high-end products under its own brand), and both are seen as likely to be at the tech heart of artificial intelligence (AI) development.
In a Bloomberg interview, ARM’s CEO Rene Haas said AI was still in its early stages: “AI is not in any way, shape or form a hype cycle… We believe that AI is the most profound opportunity in our lifetimes, and we’re only at the beginning.”
Meanwhile, Nvidia threatens to overtake Amazon as the fourth most valuable US company. Its market cap is now $1.72 trillion, and Amazon is at $1.76 trillion as of last Thursday’s close. Nvidia added $600 billion in the past two months alone, which is about the same as Tesla’s worth.
So is this a repeat of the dot.com bubble? The first thing to note is that contrary to back then, ARM’s rally was based on hard revenue and profit, and both are growing extremely quickly. Nvidia is doing the same. Its expected next 12-month’s earnings are almost four times the level of one year ago, and that was already after the release of ChatGPT demonstrated to the world the potential of AI, and saw Nvidia become the main provider of the required computer chips.
The other thing to note is that, unlike the dot.com bubble, there are few stocks involved. The rally in the ‘Magnificent 7’ has been responsible for almost all of the performance of the US stock market this year. Indeed, the group seems to have become the ‘Magnificent 6’, because Tesla appears to be doing rather poorly.
But even though there is a disparity in performance, it is worth looking at the valuation of the US market as a whole. Our top-down price model of the S&P 500 calculates an estimate of price using bond yields and a form of fixed growth estimate derived from the past 25 years. Until recently (beginning of 2022), it tracked and predicted the index very closely. Now, however, the S&P 500 is at 5,000, which is 40% higher than the model estimate of 3,500.
The only other time with such a premium was during the dot.com bubble. But we should also note that the S&P 500 reached well over 100% of the fixed growth-rate model by the start of 2000. Thus, if we are in a bubble, at least one instance suggests there could be a lot more upside from here, especially if the winners this time around are producing profits – not losses – as back then.
As the Q4 earnings season progresses, nearly 70% of companies have published their results in the US and 40% in Europe (which includes UK companies). JP Morgan Research tells us earnings growth is tracking at
+5% year-on-year (yoy) in the US, but is -8% (yoy) in Europe. The difference in current growth outcomes is very likely substantially caused by the economic disparity we have mentioned too often.
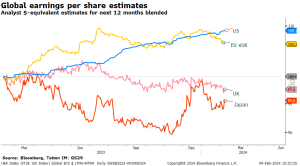
But we have to mention it again, as this week sees the release of economic growth data for Q4 2023 for the UK, Europe and Japan. UK and Europe had very slightly negative growth in Q3, while Japan was -0.7% quarter-on-quarter (qoq). Japan will probably bounce back a bit (expected +0.3% according to Bloomberg), but both UK and Europe are expected to post 0% qoq. If the data disappoints and there are no revisions upwards, we will be said to be in a recession – at least technically. In this light, the disappointing earnings growth is not really a surprise. Below shows the track of analyst earnings estimates (rebased into US dollars for comparability) for the different markets:
Europe’s companies (including the UK) are also priced higher than our Europe model would indicate, but
by only 20%, which is unsurprising given the current slower growth trajectory.

Not all US stocks have done well in the past week. Some banks have been under pressure after New York Community Bancorp announced losses. We write about signals of potential contagion below.
Positivity about the mega-caps and AI stocks in the US (and that small number listed outside the US, like ASML and ARM) seems unshakeable, but one might think that this makes these companies dangerous to invest in, given the high valuations. Can earnings growth that is currently expected to be sustained for quite a while justify those valuations? And, even if they cannot – as Tesla is finding out – can people believe for long enough as they did in the late 1990s? What should one do if this is another asset bubble? We will delve into this conundrum further over the coming weeks.
Banks & US commercial real estate
Following the collapse of several regional US banks last year, many investors started to think that after this clear-out, life would get easier for lenders. However, as we noted last week, recent events have delivered a reminder that, for some, trouble still lies ahead.
New York Community Bancorp (NYCB) made international headlines after it announced a surprise Q4 2023 loss, cut its dividend and set aside $500 million to cover potential loan losses. Markets sent NYCB shares down 44% in two days and tried to guess who else might be in a similar position.
Bad news about US commercial real estate loan losses continued to emerge over the following days, but not from domestic US banks. Japan’s Aozora Bank said it expects a $191 million loss for the current fiscal year, while Deutsche Bank lifted provisions for loan losses tied to US commercial real estate to €123 million, up from €26 million a year ago. Share prices fell for both banks. The fallout continued last week when analysts at Morgan Stanley recommended clients sell senior bonds issued by Deutsche Pfandbriefbank AG, triggering losses in most real estate bonds from German lenders.
Globally, commercial real estate is a problem. One might think a strong economy would mean the difficulties would be less apparent in the US, but the opposite appears to be the case. NYCB’s losses were focused on commercial property lending in and around New York. Japan’s Aozora lent aggressively in the US, thinking American offices were a stable market with returns to be made. Morgan Stanley’s recommendation against Deutsche Pfandbriefbank was entirely because of its exposure to US commercial real estate.
America’s existing commercial properties are seeing significantly less demand than a few years ago, which is not dissimilar to other nations. Physical retailers have been under threat for ages as the pace of change in shopping habits accelerated. Work patterns were also changing, although more slowly. However, the pandemic caused a step-change, making work-from-home (almost) the norm. It also caused a large group of people to shift their actual locations. As evidenced in London, demand for offices in big cities has not fully recovered to pre-pandemic levels.
Perhaps the only strange thing about US commercial property troubles is that they have taken quite so long to materialise, but why we are only hearing about losses now makes sense. Commercial real estate loans are usually medium-term, but are fixed as a spread over short-term rates (not dissimilar to UK tracker mortgages). The loans are assessed periodically (rather than on a constant basis) to ensure the borrowers remain within their financial health commitments. If they are found not to, the loans are either called or the spreads are increased. Many lenders have chosen to extend those periods, given they want to give ‘good’ borrowers flexibility.
Also, while we have just been through the sharpest short-term interest rate hiking cycle in a generation, markets have implied rate declines going forward throughout. Markets continue to suggest rate cuts are not far off, but actual short-term rates remain at the highs.
Now, banks either have to assess their loans after that extended review period or face maturing loans. During this year and next, a record amount of loans to America’s $5.8 trillion commercial property market (should) mature and need refinancing. Further review delays are impossible, and many borrowers will undoubtedly struggle with significantly higher potential spreads.
Then there is the simple fact that we are at the time of year when companies announce their results. No business wants to disappoint its shareholders, so losses are always hushed until they must be revealed, and damage control plans are made. NYCB, for example, had already shuffled its corporate structure to soothe investor fears following its downgrade to ‘junk’ bond status by ratings agency Moody’s. When regional US banks came under pressure last March, we said there would be significant fallout – even after the Biden administration’s deposit guarantee – but that the fallout would not be felt for some time. Now that bill has come due.
While US commercial property is the biggest concern, it is far from the only one. Swiss private bank Julius Baer announced a 50% drop in its profits because of its exposure to the distressed Austrian property group Signa. Commercial property across the Western developed world is ailing because the trends underlying it – digitalisation and a sharp increase in interest rates – are global. This is without mentioning China’s longstanding property woes, though these have different origins.
Global trends and accounting timelines mean it is no surprise banks far and wide are facing issues simultaneously. And naturally, when multiple banks start failing all at once, people get very concerned. Just like last year, when the demise of Silicon Valley Bank and Signature Bank spread shockwaves across the Atlantic, talk of financial contagion and flashbacks to the 2008 global financial crisis has been prominent in the last couple of weeks. But problems with a common cause are not the same as systemic weakness, much less contagion.
All the smaller banks that have come under significant pressure in the last week have done so because of their own positions. Most local banks have large exposures to their locale’s commercial property, but NYCB chose to significantly expand its own commercial real estate loan book, a strategy that proved ill-timed. The expansion also pushed NYCB into a different (and much more onerous) regulatory regime which caused it to need more capital.
But there are few signs that troubled banks are infecting others. In 2008, losses transmitted through tight but opaque links, leading to a run on virtually all banks. Right now, multiple banks worldwide are struggling for largely similar reasons, but they are not struggling because the other banks are struggling.
Moreover, those regional banks under pressure are relatively small (and it should be pointed out that none of them have actually failed yet). With no clear sign of linkages, and no systemically large players to move the market, there is no sign of a ‘domino effect’ at the moment. Indeed, US Treasury Secretary Janet Yellen said last week that the problems seemed manageable, and framed the problem as one for property and bond owners rather than markets at large. This is significant since the Biden administration has already shown its willingness to step in to avert any signs of banking crisis last March, when it guaranteed deposits of up to $250,000.

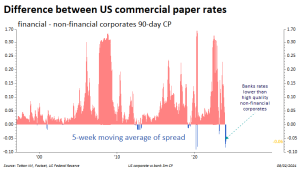
Currently, as the chart above indicates, US banks borrow at a lower interest rate than non-financial corporates – which could be taken as evidence that there is no stress in the US banking sector. However, some commentators suggest the US Federal Reserve (Fed) might be pumping liquidity into banks because of concerns about systemic fragility, and that central bank liquidity is reducing bank demands for funds through market-based mechanisms. If that was the case, the chart also shows there is no particular clear link between periods of crisis and a negative spread.

In normal times, banks are relatively risky compared to investment-grade non-financial corporations, and therefore have to pay slightly more to borrow. Some say the current discount signals the opposite of stress, and that banks are effectively over-capitalised.
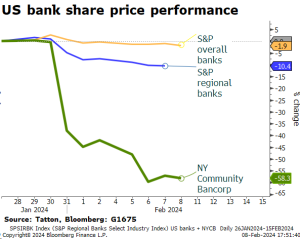
At a primary level, investors do not seem to see signs of contagion. The graph to the left shows share price performance of all major US banks, the regional bank sub-group, and NYCB itself.
Overall though, the US commercial real estate issue may exist because the US economy is extremely dynamic. The ‘old’ is failing faster there because of rapid investment in the ‘new’; new homes, new ways of working, new plant and machinery. It is important to note that the available balance sheet reserves outweigh the current losses (and the US is helped by the fact that losses are also borne by capital from overseas). Meanwhile, the investment is creating significant growth. The dangerous period comes not now but when investors in the new want to see that new investment come good.

If anybody wants to be added or removed from the distribution list, please email enquiries@cambridgeinvestments.co.uk
Please note: Data used within the Personal Finance Compass is sourced from Bloomberg/FactSet and is only valid for the publication date of this document.
The value of your investments can go down as well as up and you may get back less than you originally invested.


